Request Monitoring Based on Prometheus
Use the Higress Console Built-In Monitor Suite
Higress Console has a built-in monitor suite based on Prometheus + Grafana, which isn't installed by default. When installing Higress with Helm, you can enable it by adding the following argument to the command line: --set higress-console.o11y.enabled=true.
helm repo add higress.io https://higress.io/helm-charts
helm install higress -n higress-system higress.io/higress --create-namespace --render-subchart-notes --set higress-console.o11y.enabled=true
Note: When installing to a standard K8s cluster (meaning without specifying global.local=true or global.kind=true), the PersistentVolumeClaim configured in the suite uses the access mode of ReadWriteMany by default. If the target K8s cluster doesn't support this mode, you can add the following argument to the command line to change the access mode to ReadWriteOnce: --set higress-console.pvc.rwxSupported=false.
helm repo add higress.io https://higress.io/helm-charts
helm install higress -n higress-system higress.io/higress --create-namespace --render-subchart-notes --set higress-console.o11y.enabled=true --set higress-console.pvc.rwxSupported=false
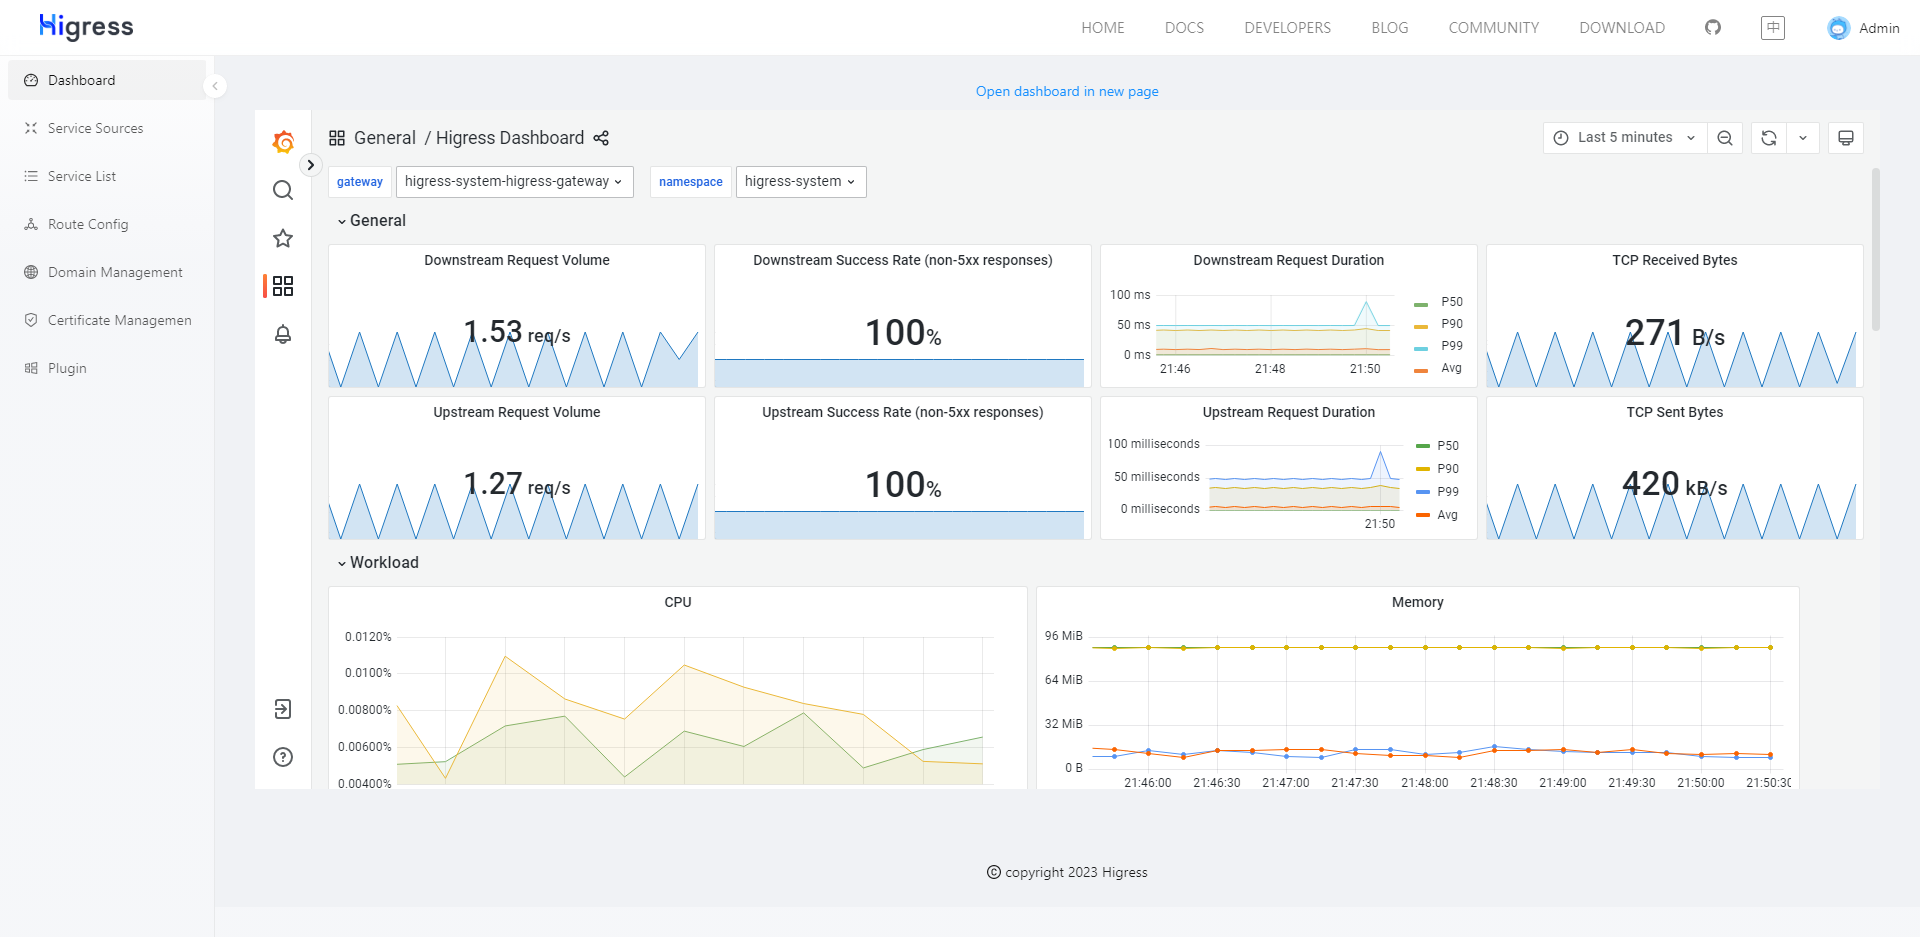
After installation, open Higress Console in your browser, and click "Dashboard" on the left navigation area. The built-in dashboard will be displayed on the right.
Use a Standalone Monitor Suite
Both the data and control planes of Higress expose a set of metrics via API. To monitor them, you just need to add probe configurations into Prometheus and configure a dashboard in Grafana.
Before starting the configuration, please open Higress Console in your browser and switch to "Dashboard" from the left navigation area. The external dashboard configuration page and related notes will be displayed on the right.
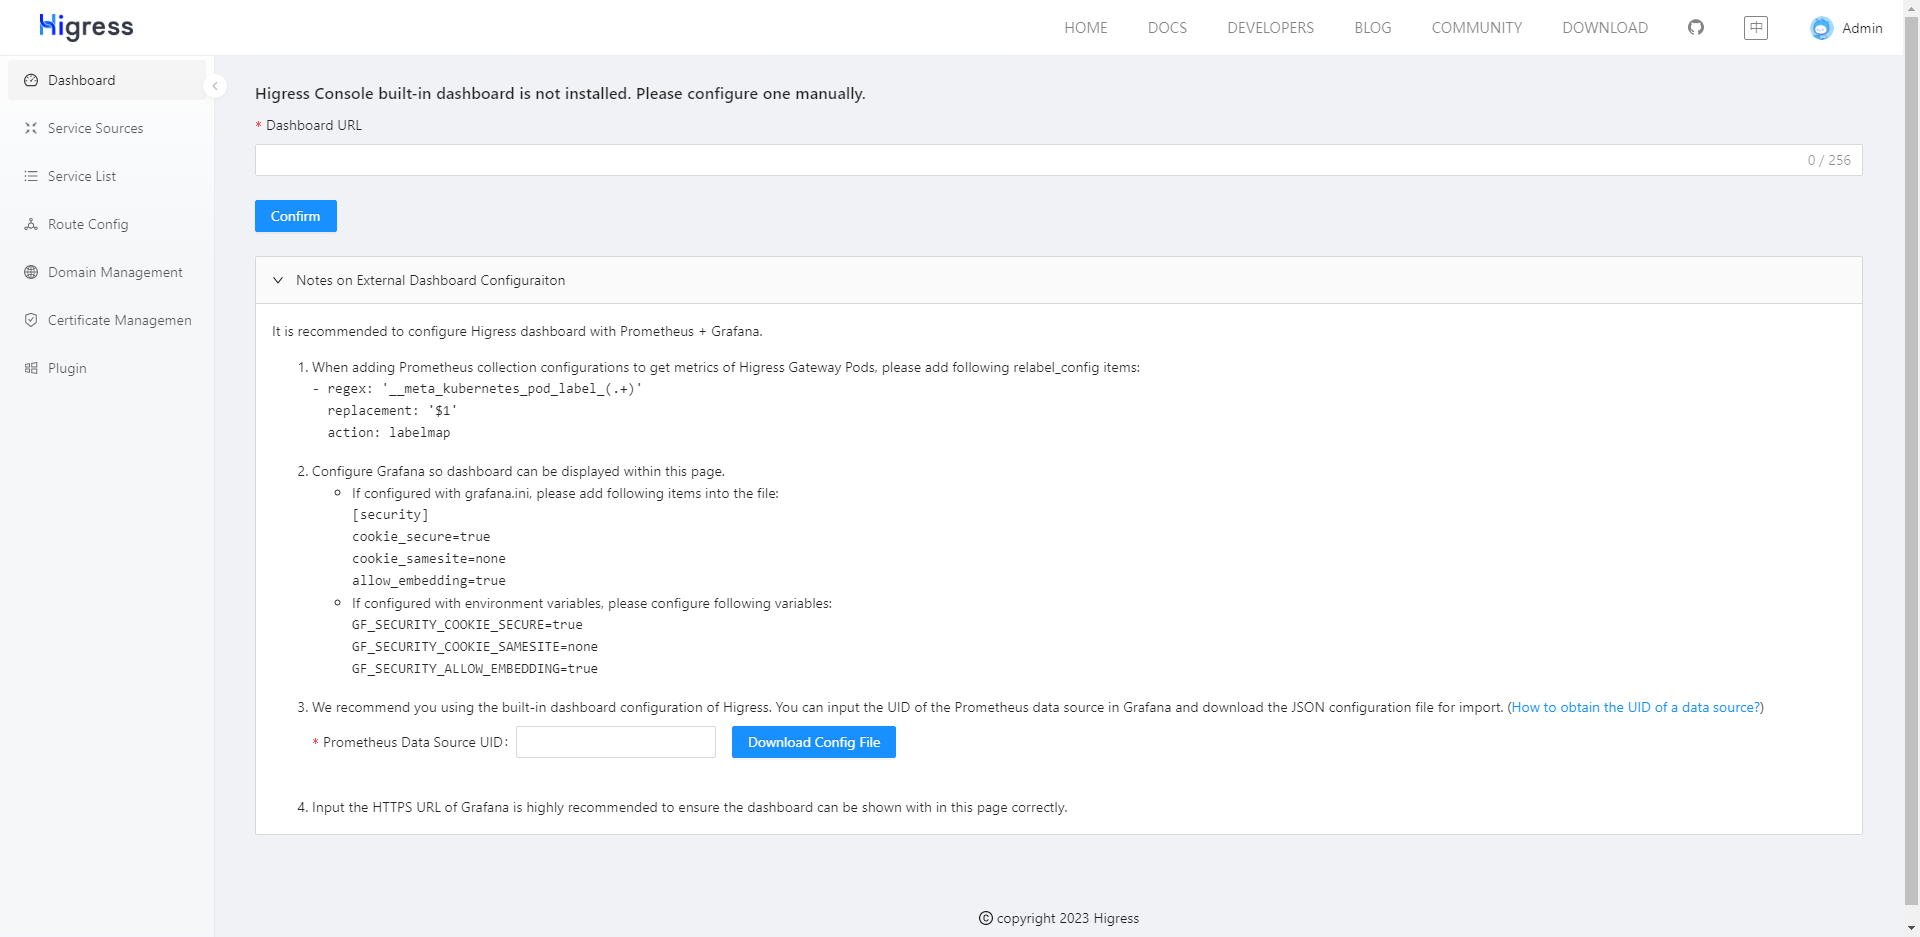
Update the configurations of Prometheus and Grafana following the notes. Then put the Grafana dashboard into the textbox above and save. The page will reload automatically and your dashboard will be shown on the right.
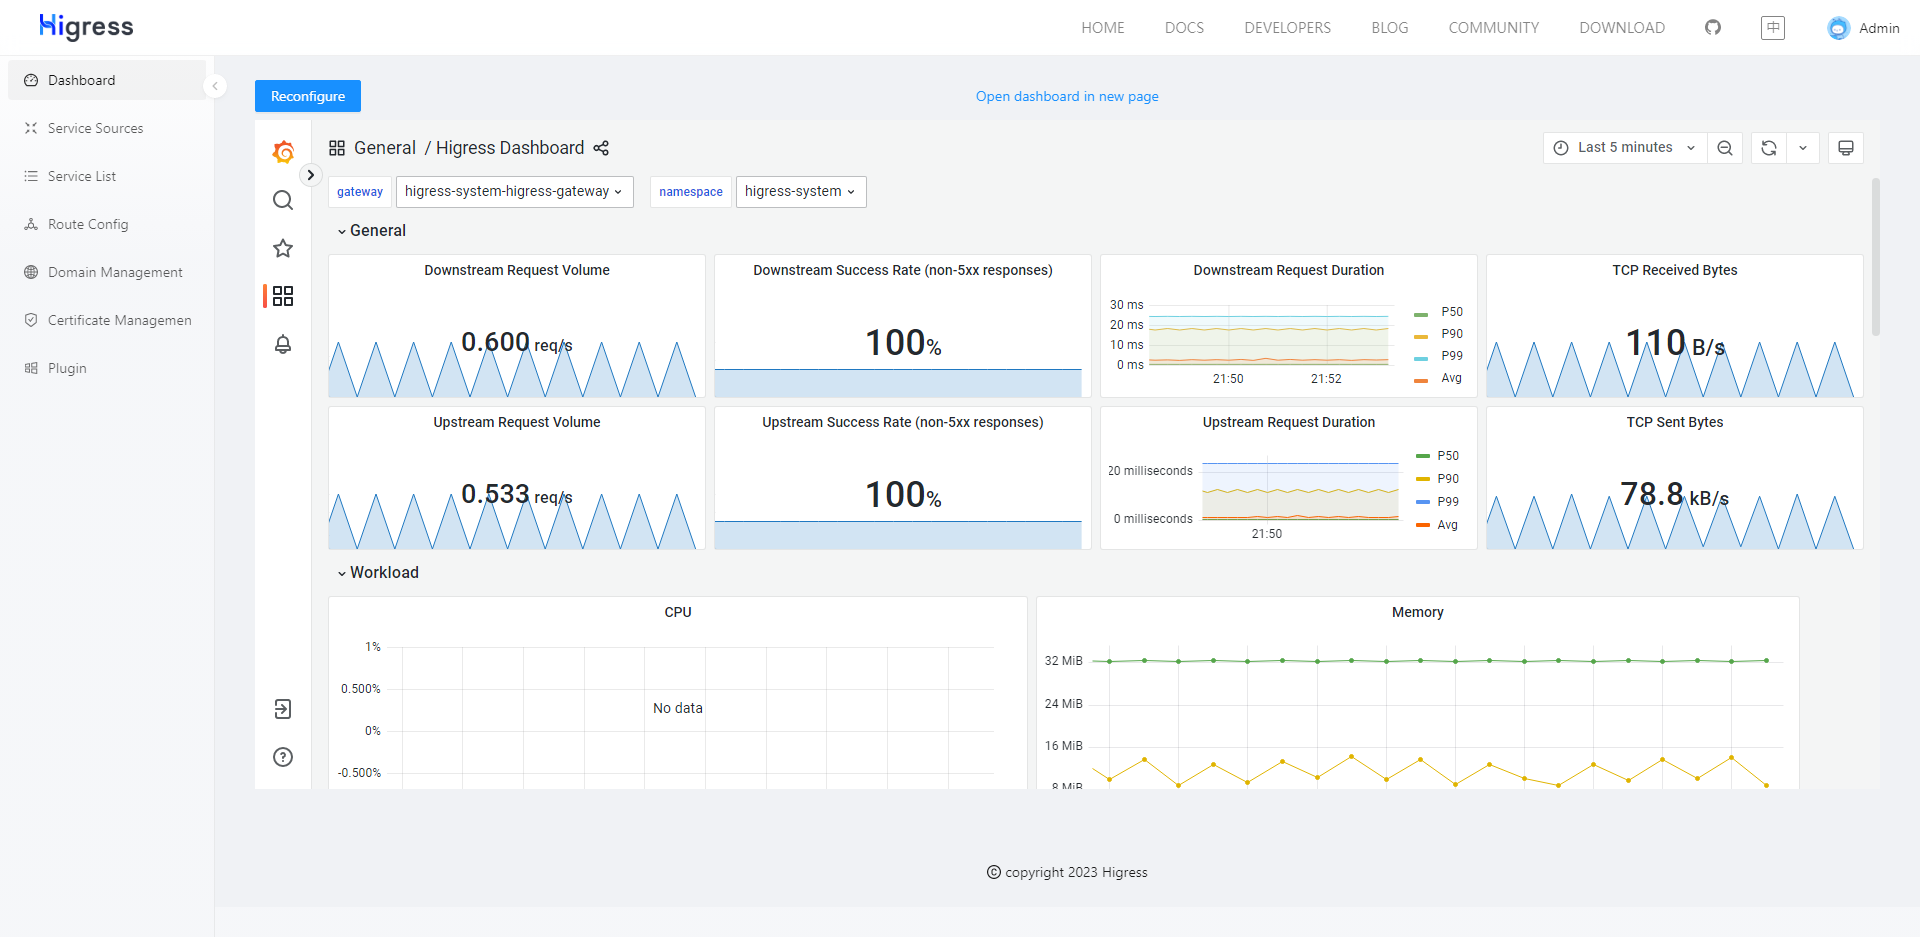
If you'd like to update the dashboard URL, you can click the "Reconfigure" button on the top left corner.